Results & Discussion
The figure below illustrates the climate change trend from time period 1986-1996 to 1997-2007. Factor 1 in x axis shows that snow accumulation is negatively related to temperature, soil temperature, evapotranspiration and solar radiation. This means that with a higher temperature and solar radiation, snow accumulation would decrease. This is very intuitive. Also, with a higher temperature and solar radiation, evapotranspiration would also increase. On the y axis, we can see the relationship between soil water content and curve number, as well as leaf area index. An increase in curve number would decrease soil water content. This is because that higher curve number represents a lower soil permeability, so precipitation would be transformed to surface runoff instead of infiltration into the soil.
The blue arrow indicates the change trend as well as the magnitude for each sub basin. As we can see, most of the sub basins shows an increasing in temperature and solar radiation. This justified our expectation that under current global warming climate trend, atmospheric temperature and solar radiation has an increasing trend, and global warming has already showed its impact on regional scale. However, we can also see a few exceptions (arrows pointing upwards. These watersheds includes sub basin 37, 47, 164 and 155. This indicates that the temperature in these sub basins do not change by a large amount, but the soil water content has increased by a drastic amount. This result is consistent with a hand calculation in percentages for each parameter of each basin. The soil water content for sub basin 37 has increased by 49% and 70% for initial SW and end SW respectively, 11% and 19% for initial SW and end SW for sub basin 47, and similar to that of sub basin 155 and 164. Overall, the results are quite consistent.
The blue arrow indicates the change trend as well as the magnitude for each sub basin. As we can see, most of the sub basins shows an increasing in temperature and solar radiation. This justified our expectation that under current global warming climate trend, atmospheric temperature and solar radiation has an increasing trend, and global warming has already showed its impact on regional scale. However, we can also see a few exceptions (arrows pointing upwards. These watersheds includes sub basin 37, 47, 164 and 155. This indicates that the temperature in these sub basins do not change by a large amount, but the soil water content has increased by a drastic amount. This result is consistent with a hand calculation in percentages for each parameter of each basin. The soil water content for sub basin 37 has increased by 49% and 70% for initial SW and end SW respectively, 11% and 19% for initial SW and end SW for sub basin 47, and similar to that of sub basin 155 and 164. Overall, the results are quite consistent.
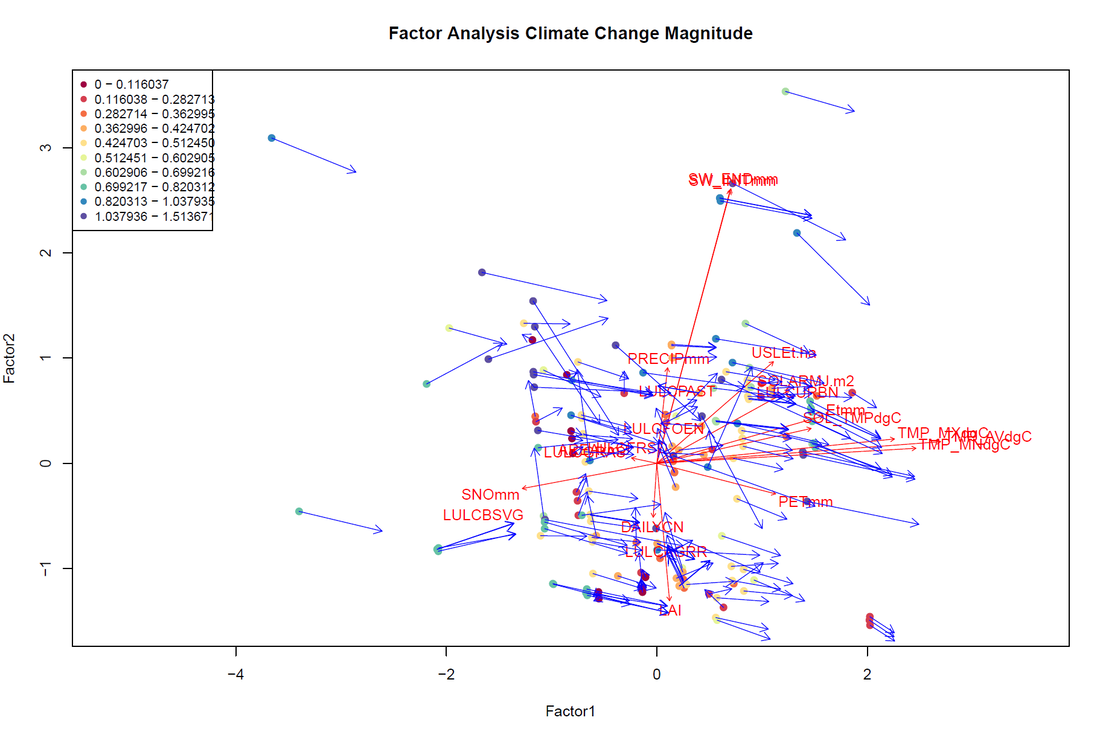
Figure 6. Factor Analysis Output
Vector Variable |
Meaning (within each sub basin) |
PRECIPmm |
Total precipitation in mm |
SNOmm |
Total snow accumulation in mm |
USLEt.ha |
Universal soil loss equation, representing soil loss as ton per hactare |
SOLARMJ.m2 |
Solar radiation in mega joules per square meters |
PETmm |
Potential evapotranspiration in mm |
ETmm |
Actual evapotranspiration in mm |
DAILYCN |
Curve number, representing soil permeability, unitless |
LAI |
Leaf area index, representing leaf coverage, unitless |
SOL_TMPdgC |
Soil temperature in degree Celsius |
TMP_MXdgC |
Maximum temperature in degree Celsius |
TMP_MNdgC |
Minimum temperature in degree Celsius |
TMP_AVGdgC |
Average temperature in degree Celsius |
SW_INITmm |
Soil water content before model simulation in mm |
SW_ENDmm |
Soil water content at the end of model simulation in mm |
LULC |
Land use / Land cover, has various types such as urban, evergreen forest and deciduous forest |
The below figure shows the overall change magnitude for the entire watershed. The color represents the length of the vector described in Figure 6. From this figure, we can see that mountain and hill foot area, whereas downstream plain region does not experience drastic change overall with a few exceptions. The major driving force of this change needs to be further determined. So far, we can conclude that under current climate pattern, snow accumulation has decreased significantly due to various possible reasons, including increase in temperature, solar radiation, or decrease in precipitation. Future work would quantitively determine which factor(s) would contribute most to the decrease in snow accumulation.
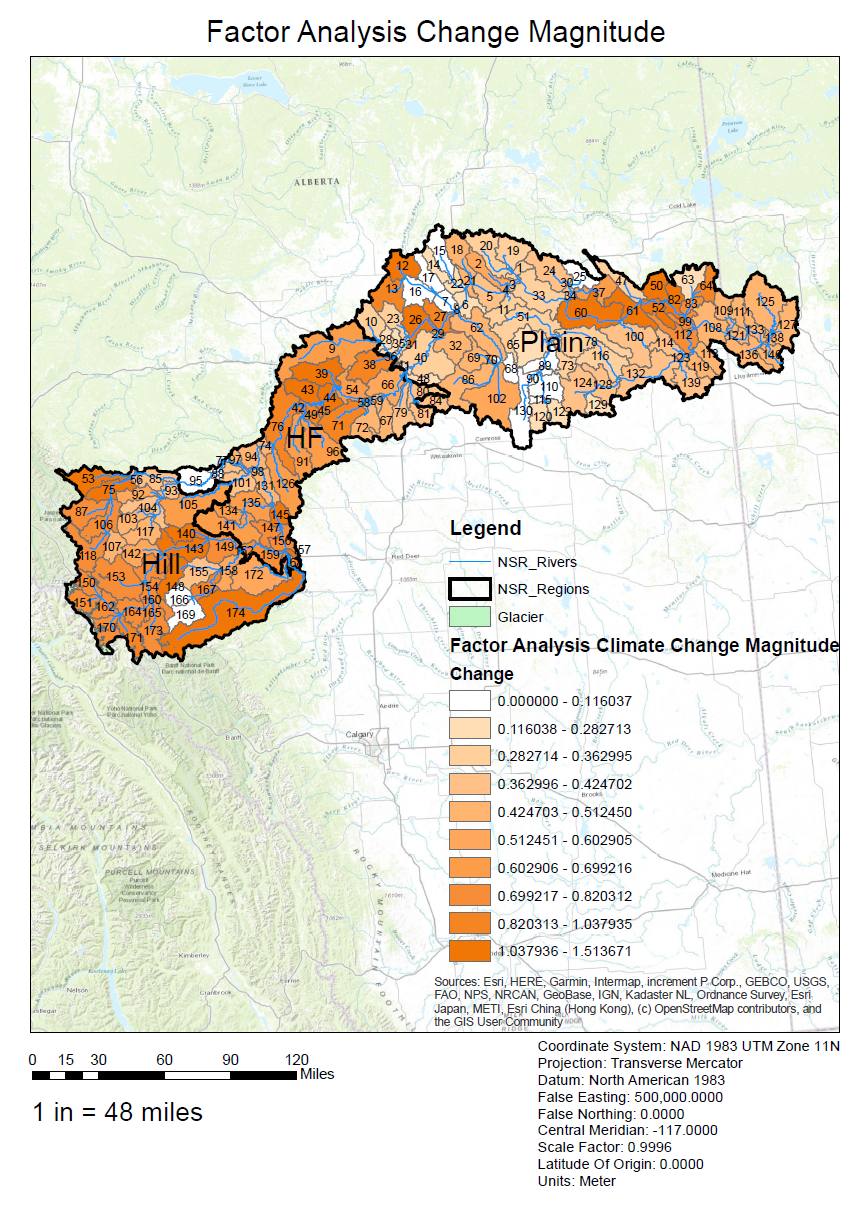
Figure 7. Factor Analysis Visualized Output
A cluster analysis was also performed to classify which watersheds can be categorized under same class. However, the dendrogram is not clear enough to be able to see. Here we used ArcMap to illustrate the classification according to their multivariate climate change. The following figure shows the clusters. By using Rstudio cutree() function, we can cut dendrogram at a particular height. Height was set to be 15 to generate sufficient branches. As we can see here, sub basin that has the same ID means that they are within the same cluster, and we notice that watersheds adjacent to each other are most likely to be within the same cluster, which is agreeable with our expectation.
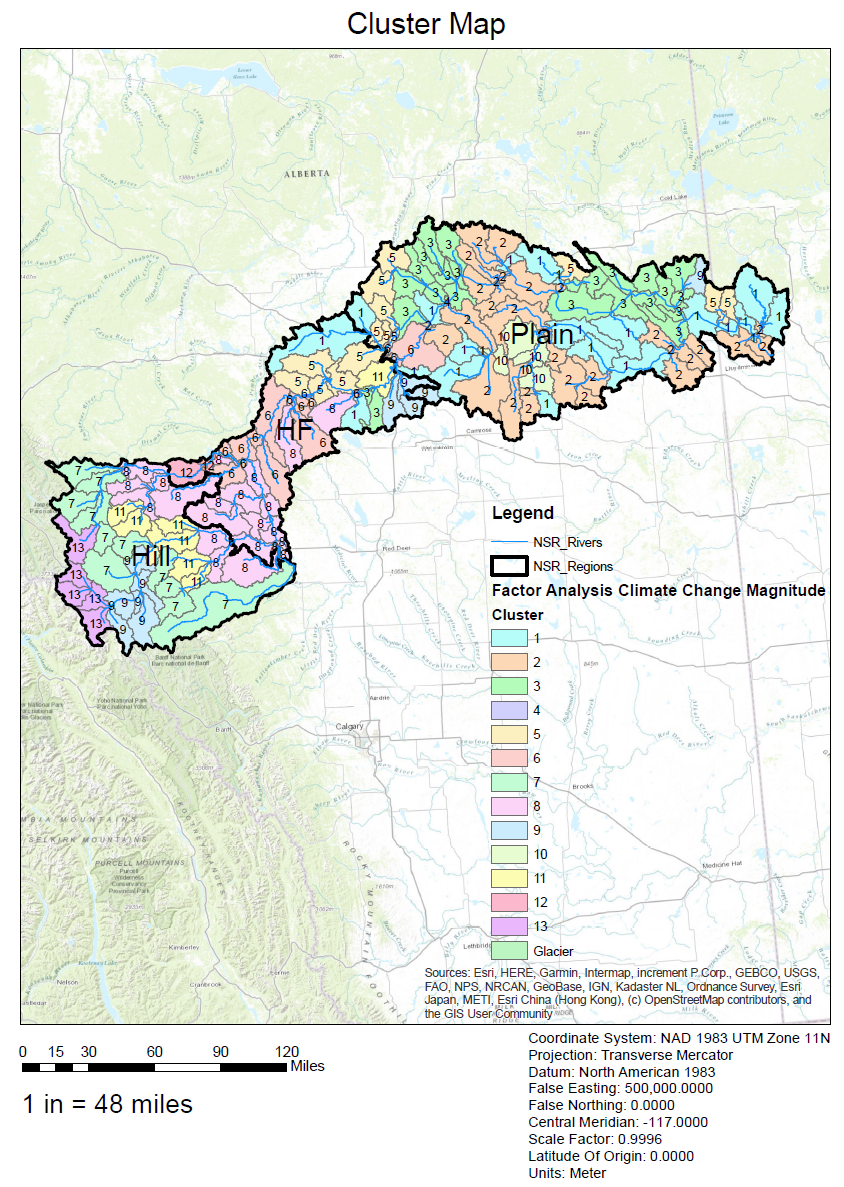
Figure 8. Cluster Analysis Visualized Output

Figure 9. Cluster Analysis Dendrogram
After finishing the classification, a Classification and Regression Tree (CART) analysis was performed to determine what are the major driving forces for the watershed. Rstudio packages "mvpart" and "randomForest" were used to generate the output. One thing to notice is that "randomForest" is a bootstrapped version for CART that shows what are the major contributing parameters to snow accumulation, but this method only performs the analysis throughout the entire study area. As a result, I sub divided the entire study area into mountain, hillfoot and plain regions, and performed same analysis for all three regions. Another issue was that when the precipitation is included in the dataset, then basically this single variable can explain most of the cases, which is very intuitive, so I excluded the precipitation to explore which parameters are also important apart from precipitation. The following figures illustrates the results.
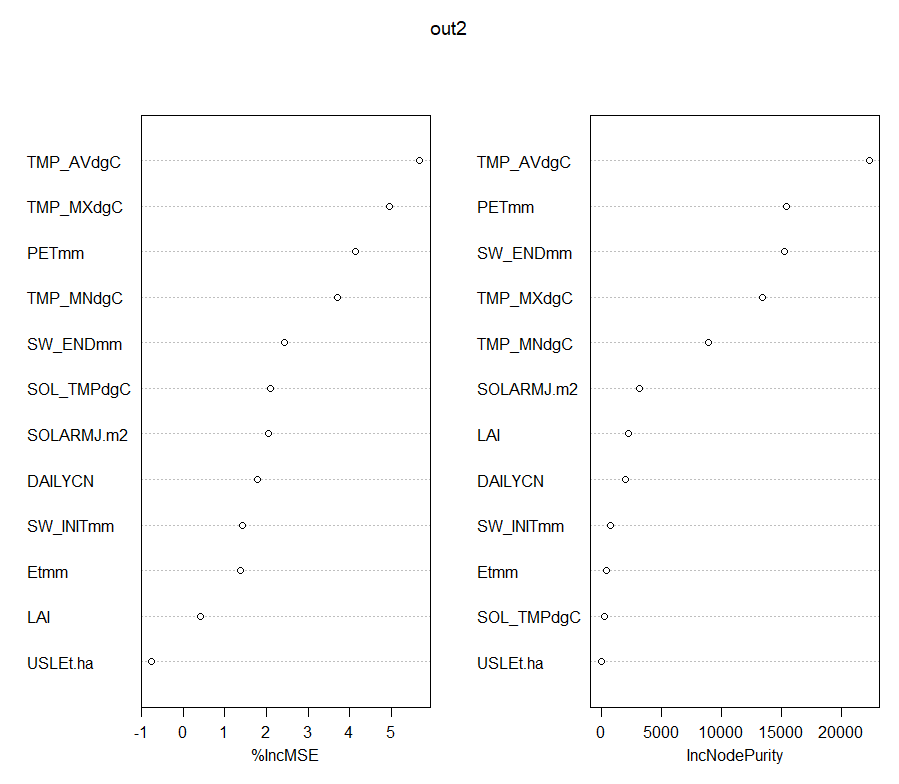
Figure 10. Mountain region randomForest output
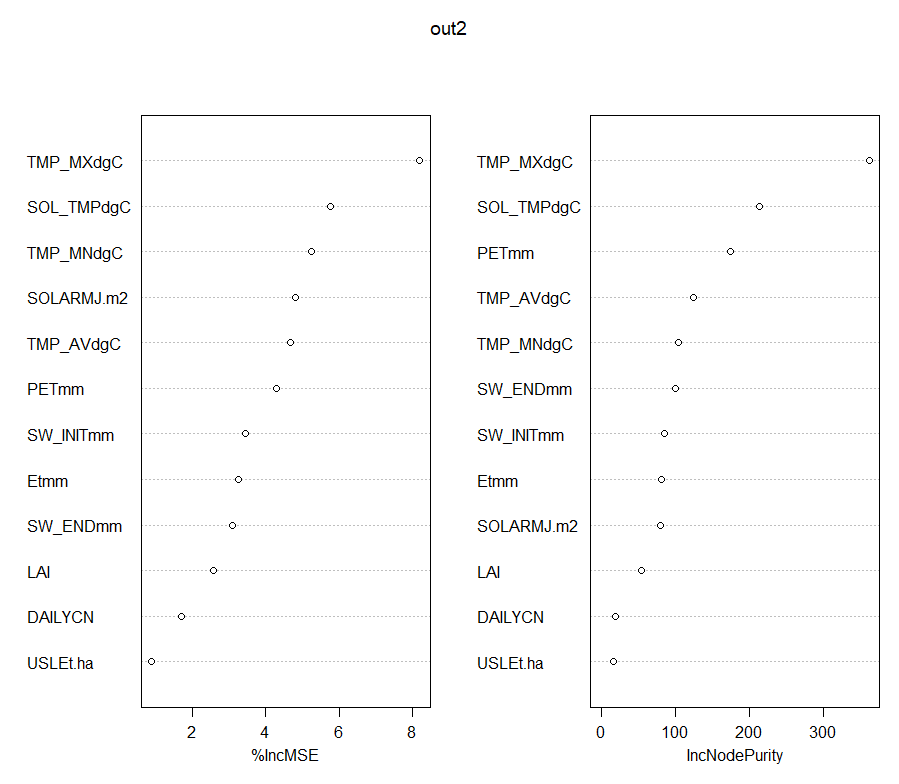
Figure 11. Hillfoot region randomForest output
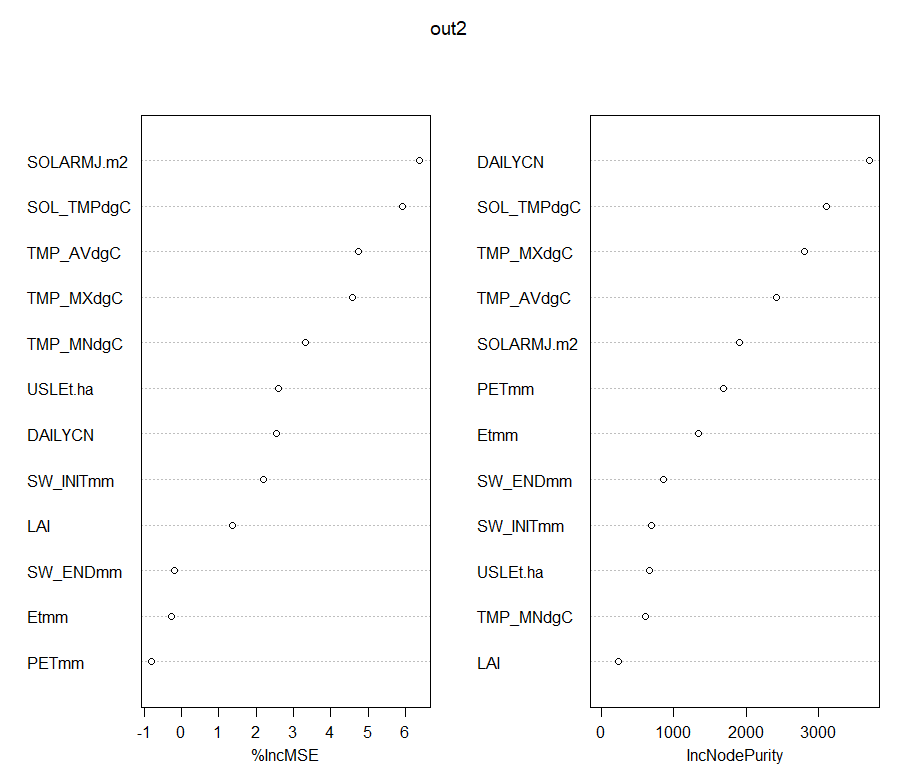
Figure 12. Plain region randomForest output
Now we can see that there are some clear differences between different regions. In mountainous region, we can see that apart from atmospheric temperature, evapotranspiration played an important role in determining snow accumulation. This is because of the high elevation for mountainous regions. Evapotranspiration is determined by various factors, including relative humidity, wind speed, temperature and atmospheric pressure. In mountainous regions, evapotranspiration is especially magnified because it usually has a higher wind speed and lower atmospheric pressure. Hence it is reasonable to say that evapotranspiration impacts more to snow accumulation in mountainous regions.
Hillfoot regions generally have a mild slope with less human activities. Hence the snow accumulation is mainly controlled by soil temperature and atmospheric temperature. But we can also see that potential evapotranspiration still play a relatively important role in this region, similar to mountain region.
Plain region is very different from the other two regions. Plain region has lowest mean elevation with more human activities, and so we can see that evapotranspiration are less important in this region, but instead, solar radiation and curve number are becoming more important. We can see that solar radiation became an important factor to determine the snow accumulation, as well as curve number. Curve number represent the soil permeability, and the less the value is, the more permeable the soil is. Soil permeability is also related to land cover. Different types of land cover could have different water holding capacity. In the plain region, with a lower elevation and slower wind speed, as well as a relatively uniform slope, other parameters may become less important, and it is reasonable that the snow accumulation become more dominantly controlled by land use and solar radiation.
Conclusion
The snow accumulation has a very clear spatial and temporal variation. Overall, we can see that the snow accumulation has decreased during a 22-year study period. The major driving force varies by different topographic regions. Precipitation and atmospheric temperature are two most important parameters that controls the snow accumulation, as well as other physical parameters. In mountainous regions, evapotranspiration is a major driving force of snow accumulation, and soil temperature dominates the formation of snow in hillfoot, as well as solar radiation and curve number for plain regions.
From water management perspective, there are multiple ways for us to reserve snow water resources. From macro perspective, the authuorities can build more water resource reservation facilities such as reservoir or dam to control the release of streamflow, especially for regions that are largely affected by snow melt or glacier melt. From micro perspective, we can promote some household scale infrastructure and encourage users to collect rainfall and snowfall precipitation for storage, such as a storage tank. In certain regions in east Asia, buildings usually have a flat roof with a water drainage system that connects to local sewage system, such facility can largely improve the rainfall and snowfall precipitation collection. Also, the extraction of alternative source needs to be properly inspected. North Saskatchewan River Basin has multiple aquifers that are well managed, but still we can see some over extraction, and most of time it is done by households. Authorities should improve their oversight strength to minimize over extraction.
From water management perspective, there are multiple ways for us to reserve snow water resources. From macro perspective, the authuorities can build more water resource reservation facilities such as reservoir or dam to control the release of streamflow, especially for regions that are largely affected by snow melt or glacier melt. From micro perspective, we can promote some household scale infrastructure and encourage users to collect rainfall and snowfall precipitation for storage, such as a storage tank. In certain regions in east Asia, buildings usually have a flat roof with a water drainage system that connects to local sewage system, such facility can largely improve the rainfall and snowfall precipitation collection. Also, the extraction of alternative source needs to be properly inspected. North Saskatchewan River Basin has multiple aquifers that are well managed, but still we can see some over extraction, and most of time it is done by households. Authorities should improve their oversight strength to minimize over extraction.
Limitation & Future Work
One major source of limitaiton is data limitaion. The land cover and soil data are relatively old and may be not as accurate as an updated dataset. The climate data collected were also historical and there were two data sources, which may have inconsistency that would impact model performance.
For the future, model should be updated with more recent data and model calibration is required. This model can also be used to predict the future climate change scenario, which is a good practice to study what climate change could impact snow drought.
For the future, model should be updated with more recent data and model calibration is required. This model can also be used to predict the future climate change scenario, which is a good practice to study what climate change could impact snow drought.
