Methods
Data collection and data process
Watershed is delineated by using 30m*30m digital elevation model, which calculates the number of sub basins within the watershed with their own geographical features, including average elevation, slope change, flow direction and flow accumulation. The DEM was provided by Watershed Science & Modelling Laboratory at University of Alberta. On top of this, due to the effect from glacier near Jasper National park, this type of water source was considered as point source input for the model. Moreover, two large reservoir were considered and their operational management was also set as a control as a model input.
Watershed is delineated by using 30m*30m digital elevation model, which calculates the number of sub basins within the watershed with their own geographical features, including average elevation, slope change, flow direction and flow accumulation. The DEM was provided by Watershed Science & Modelling Laboratory at University of Alberta. On top of this, due to the effect from glacier near Jasper National park, this type of water source was considered as point source input for the model. Moreover, two large reservoir were considered and their operational management was also set as a control as a model input.
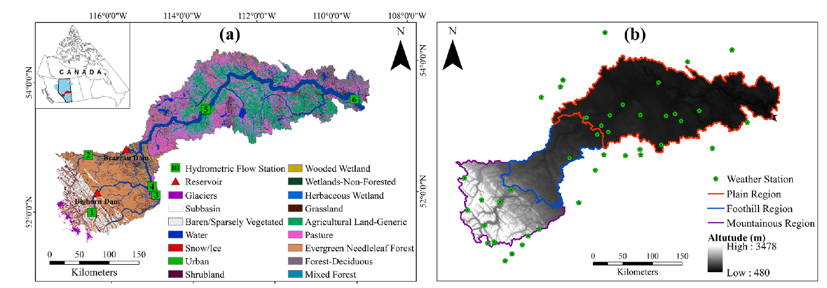
Figure 2. NSRB Land Cover and DEM
Climate data including precipitation, average/max/min temperature and solar radiation are collected from US National Center of Atmospheric Research. Land use / land cover map and predefined watershed boundaries was collected and processed by Watershed Science and Modelling Laboratory at the Faculty of Earth and Atmospheric Science, University of Alberta. Potential/actual evapotranspiration, initial/end soil water content, daily curve number, soil temperature, universal soil loss and leaf area index was modeled by using ArcSWAT (Soil and Water Assessment Tool), powerd by ArcGIS, ESRI.
These climate data were required as a model inputs for ArcSWAT, and the model is calibrated and validated by comparing modeled output with observed historical flow within the watershed. Six water gauges were used for calibration and validation. Climate data was collected as gridded format, and was processed by using ArcSWAT to apply the data into sub-basin scale. Outliers were removed based on observed extreme high/low values.
These climate data were required as a model inputs for ArcSWAT, and the model is calibrated and validated by comparing modeled output with observed historical flow within the watershed. Six water gauges were used for calibration and validation. Climate data was collected as gridded format, and was processed by using ArcSWAT to apply the data into sub-basin scale. Outliers were removed based on observed extreme high/low values.


Figure 3. Land Use and Solar Radiation Change in NSRB
ArcSWAT Hydrologic Model
The primary software used in this project is the ArcSWAT extension for ArcGIS, used as an interface for the Soil Water and Assessment Tool (SWAT, a public domain model developed by USDA Agricultural Research Service and Texas A&M AgriLife Research.)
Soil and Water Assessment Tool (SWAT) is a widely used semi-distributed, physical process-based hydrological model that has been successfully applied to many watershed studies regarding water quantity (Faramarzi et al., 2012; Mango et al., 2010; Worku et al., 2017), which can simulate water behavior, water quality, soil processes and plant growth cycles based on input climate, land use/land cover, digital elevation model, soil data, glacier melt and other water resource management measures such as reservoir operation or sediment transport mechanism. For model calibration and validation, Sequential Uncertainty Fitting program (SUFI-2) is applied to compare model simulation with observed flow gauges. This approach allows us to understand the differences between using simulated and estimated glacier melts in the model and to analyze both models’ parameter sensitivity.
Soil and Water Assessment Tool (SWAT) is a widely used semi-distributed, physical process-based hydrological model that has been successfully applied to many watershed studies regarding water quantity (Faramarzi et al., 2012; Mango et al., 2010; Worku et al., 2017), which can simulate water behavior, water quality, soil processes and plant growth cycles based on input climate, land use/land cover, digital elevation model, soil data, glacier melt and other water resource management measures such as reservoir operation or sediment transport mechanism. For model calibration and validation, Sequential Uncertainty Fitting program (SUFI-2) is applied to compare model simulation with observed flow gauges. This approach allows us to understand the differences between using simulated and estimated glacier melts in the model and to analyze both models’ parameter sensitivity.
